Iceland Fossil Fuel Dashboard: New Insights into Energy Use Across Regions
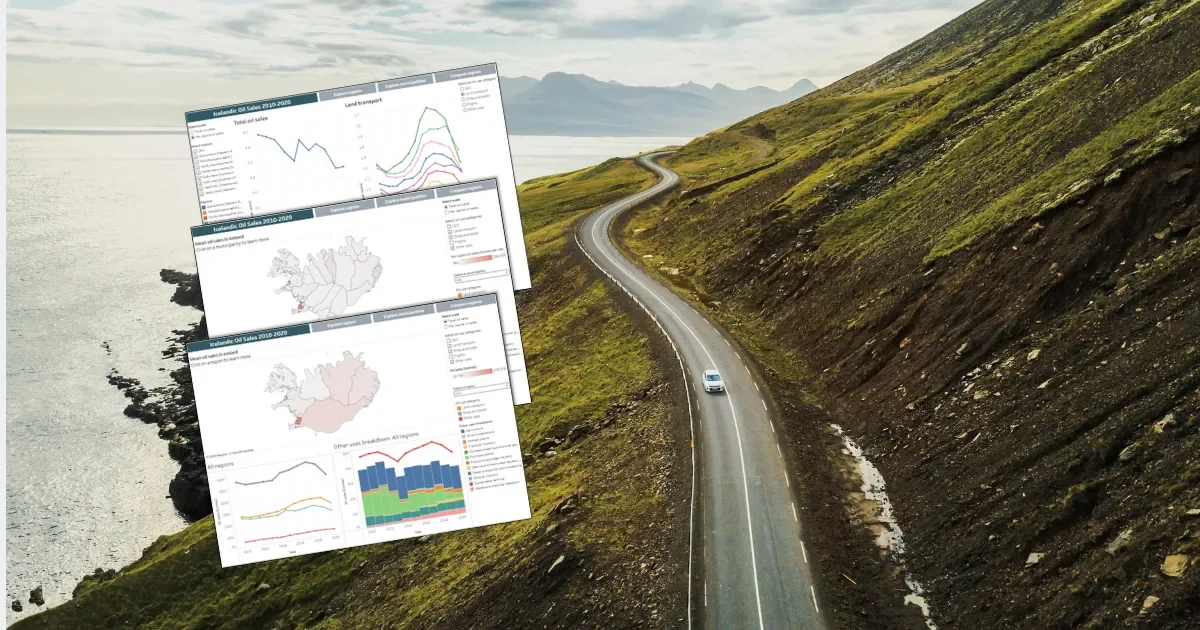
The RECET partner Eimur proudly presents the Iceland Fossil Fuel Dashboard, a new interactive tool that provides detailed insights into fossil fuel sales and consumption in Iceland from 2010 to 2020. The dashboard allows users to explore data by region or municipality, fuel type, and quantity — both in total figures and per capita — and enables users to generate and save customized graphs for further analysis.
The dashboard builds on the report Oil Consumption of Icelandic Municipalities, previously published by Eimur in collaboration with Efla. Both the report and the dashboard were developed as part of the RECET project.
Data-driven insights for a just energy transition
Iceland has legally adopted ambitious climate goals, aiming to achieve carbon neutrality by 2040 and become fossil-fuel free by 2050. Despite these targets, Iceland currently imports around one million tonnes of oil each year. While more than 60% of the population lives in the capital area, successful energy transitions must also reach rural regions and smaller municipalities. Real climate progress can only be achieved through the participation of all parts of society.
The Fossil Fuel Dashboard makes it possible to examine how oil sales are distributed across sectors and regions, offering a clearer picture of where Iceland currently stands in its energy transition and where targeted action is most needed. The data reveal significant regional differences, including:
The capital region having the highest total fossil fuel sales, but the lowest per-capita oil consumption
South Iceland showing the highest per-capita fossil fuel use in land transport
East Iceland having the highest per-capita fossil fuel consumption in fisheries
These differences highlight the importance of evidence-based policymaking that takes local conditions and needs into account. The dashboard is designed for a wide range of users — including municipalities, policymakers, researchers, and the public — and offers an intuitive, interactive experience where users can select regions, time periods, and fuel types, and download results for further use.
Preserving critical data for the future
The data underlying the dashboard originate from the Oil Products Transport Equalization Fund, which operated between 2010 and 2020. Icelandic authorities no longer collect these detailed datasets. Eimur therefore takes this opportunity to encourage the Ministry of Environment, Energy and Climate and the Environment and Energy Agency Iceland to resume the systematic collection and publication of fossil fuel sales data. According to Eimur, such data remain one of the most reliable indicators of progress toward a fossil-fuel-free Iceland by 2050.
Collaboration and development
The Fossil Fuel Dashboard was developed jointly by Eimur and Efla. Programming was carried out by Inbal Armony as part of her final project in the SIT Study Abroad programme Climate Change and the Arctic. Inbal Armony is a student at Macalester College in Minnesota, USA, studying climate science, public policy, and data science. In 2025, she spent a semester in Iceland as part of the SIT programme, focusing on Iceland’s unique natural environment and climate action efforts.
Eimur warmly thanks Inbal Armony and Efla for their excellent collaboration and contribution to making this valuable data accessible and actionable.